Posts

Learning Python & Data Analysis

Image
Introduction Recently I have been teaching a friend how to programme in the language called Python and I thought I would make the resources we have been using available to all. Most of the material is based on the book called Automate the Boring Stuff. I have adapted those open source materials as needed for our programme. Additional Resource Links Automate the Boring Stuff  with Python Python Tasks   Preface · A Byte of Python   PY4E - Python for Everybody Welcome to Data Analysis in Python! — Data Analysis in Python 0.1 documentation School of Data - Evidence is Power Trinket Tool  Data Analysis Tools from 2022 Pivot Tables in Google Sheets Tutorial  Kaggle - Machine Learning Data Analysis  How to Create a Dashboard in Google Sheets (10 steps) - Query Formula - YouTube How to Create Dropdown Filters on Google Sheets Dashboard Using QUERY Formula (ADVANCED TRICK) - YouTube How to Build a Professional Dashboard in Google Sheets (Query Formula Advanced Course) Step-by-Step - YouTube

Mathematics From Early Childhood Into Late Primary in South Africa

Image
Getting to Grips with Primary School Mathematics in SA  After many years of teaching high school maths, I suddenly find myself needing to upskill and understand the way mathematics is taught at the primary school level because of my involvement with a local NGO. Like everything in life you just start at the beginning, so this is that beginning. Hopefully, over time, I will add to this list based on my interactions with other primary school teachers.   CAPS for Mathematics  GR R-12 Wits  Maths Connect Primary Olico  Times Table Challenge   Living Maths  Organisation in SA  Timss&Pirls  overview of SA Mathematics Curriculum  Number Sense Website  https://www.numbersense.co.za/ SA Maths Foundation  Research in SA  SAMF Calendar events in SA in  2022   Why Number Sense  https://jumpstart.org.za/why-number-sense/  Teacher  Navigation Packs  for ATP's Pearson ANA's  Diagnostic Assessments   Quality Maths Resources SA Curriculum CAPS Mapping  https://za.ixl.com/standards/maths Per

Useful Research Tools List

Image
Intro Over the last couple of years as I have got into the world of Academia, certain tools have made my life much much easier. I thought I would put them all together in one place in case someone else finds them helpful and also so that I don't forget that they exist, going forward. Some Useful Links  Tools I've Used  Zotero - amazing reference and content management system Google Docs / Microsoft Word  Google Sheets / Excel Google Forms / Microsoft Forms  Qualtrics - high quality powerful survey software and Data Analysis  Timeline JS - making useful Timelines from spreadsheets  Diagrams.net - free tool for complex diagram drawing integrates with Drive / OneDrive Google Data Studio - for Data Analysis  Atlas.Ti for Qualitative Data Analysis  Temi - Transcription Services for Audio  Google Scholar   - Access to References Quickly BASE - Academic Search Engine  TurnItIn - Writing Feedback and Plagiarism Check  Grammarly - Writing Feedback and Error Correction  SocNetV

A little bit about OneNote for Maths Teachers

Image
Intro Over the last year or so I have increasingly been using Microsoft OneNote to author my maths lessons. I think a lot of maths teachers would benefit from having a closer look at the tool as it has a lot features that lessen the amount of work a maths teacher has to do when preparing lessons. It is also very easy to work with, when collaborating with other maths teachers because of the native sharing functions it has. Some Useful Links  These are a collection of links I saved to help with common problems I had when starting to use OneNote as Maths Teacher.  My Online Notebooks URL   (link to the online version) Export and Import Copies of OneNote Notebooks  Import Whole Notebooks into OneNote Online URL Great OneNote Youtube Tutoria l for Maths Teachers  Summary I plan to return to this post in future and update it as I continue using OneNote in my Mathematics Teaching in 2022. 

Participating in a Maths Explainer Competition with 3B1B

Image
Intro Recently I entered the 3 blue brown maths explainer competition. I really enjoyed participating, as it gave me an opportunity to focus and practice my mathematical lesson design skills in a way that I probably normally wouldn't do. I also came across some great advice in the process and learned quite a few new skills.  Advice Here is the general advice put forward at the beginning of the competition by the organiser. I think it's really good advice to keep in mind whenever you are designing a lesson or an explanation for a mathematical concept. My Entry Here is the entry that I put forward for the competition. I tried to explain trigonometry in a more intuitive and lower level type of way, in the hope that could take away some of the mystery and make the core ideas accessible and understandable. I also learn't some new PowerPoint animation skills along the way and I'm pretty happy with the end result. I also came across a really cool way for judging project subm

Getting an Overview of Statistics & Data Analysis for Use in Academics

Image
Intro Here are a collection of links that give great outlines of important statistical concepts that you will find useful if you are trying to conduct academic research. These videos are chosen deliberately for their conciseness and clarity. Dr Nic  Types of Data   Types of Data Identifying Variation and Sampling Error  Sampling Methods   Designing a Questionnaire or Survey   Writing Good Survey Questions   Summary Statistics   Summary Stats with Measures of Spread  Statistical Inference  The Idea Behind Inference Understanding Statistical Significance   Choosing Statistical Tests   Correlation vs Causation  Mixture  Levels of Measurement  - Organic Chemistry Tutor  Research Methods - Levels of Measurement   IB / A Level  Choosing Statistical Tests  Help for Students doing IA   Choosing Tests   Crash Course  What is Statistics?

Finding Academic Information Efficiently

Image
  Intro Here are a collection of links that give great advice on how to track down academic information efficiently over time. It could be particularly helpful for postgraduate students who are finding the accessing and sorting of academic information overwhelming. https://paperpile.com/g/academic-search-engines /  https://paperpile.com/guides/research / https://paperpile.com/guides/writing/   https://paperpile.com/g/search-online-research-database/   https://paperpile.com/g/academic-research-databases/   https://paperpile.com/g/google-scholar-guide /  https://paperpile.com/g/search-online-research-database /  https://paperpile.com/g/eric-research-database/   https://paperpile.com/g/what-is-research-paper/   https://guides.library.ucla.edu/databases/choosing  

Understanding Social Network Analysis with a Focus on Teacher Collaboration

Image
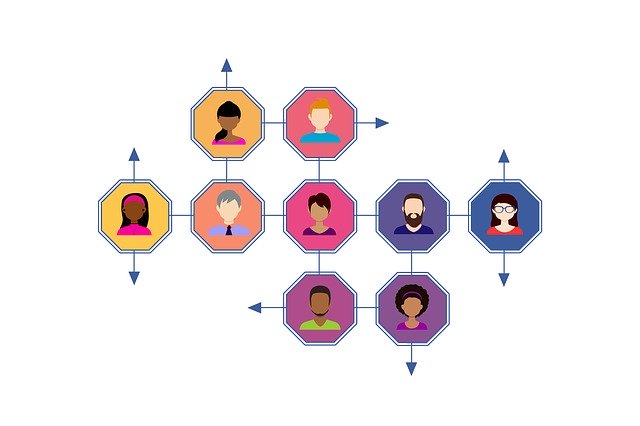
Image by Gerd Altmann from Pixabay Introduction As part of my minor dissertation I am really having to up-skill on Social Network Analysis (SNA). This is a collection of the best stuff I have found on the the web to help me learn. This covers collecting data as well as visualising of the data and the calculation of various related descriptive statistics.  Update April 2021 Comprehensive resource for overview of Network Structure  in YouTube video and really great explanations About  Network Canvas  and citing it  and article about it Tools for Gathering Social Network Survey Data  Showcasing building a SNA Survey in Qualtrics - this is the method i have used Newer tech GENSI  with a graphical approach to capturing SNA data, that could possibly be integrated into Qualtrics  Network Canvas - very new but looks promising and free  Tools for Drawings Network Diagrams and Descriptive Stats 1) Ucinet - link to site   2) Netdraw  - link to site 3 ) Gephi - link to site   4) SocNetv - link

The Mathematics of Vaccine Trials (COVID 19) - a rich context for authentic learning

Image
  Introduction  As the results of the phase three trials for the first successful vaccines against the coronavirus are released, my mind couldn't help but gravitate towards the mathematical nature of the results revealing process. The idea of designing a trial to test for the efficacy and safety of a vaccine is inherently mathematical in nature. I began to ask myself what are the sort of ways that I could use this situation to teach mathematics to my students and get them more interested in the mathematical content and the theory behind this type of situation. The most obvious tie up is in the area of data and probability and understanding how scientists leverage established knowledge in this area, to design effective vaccine trials. Here are a list of articles I found and some questions I thought of, that may be of use if I was to develop this idea further. Please feel free to add your comments below if you have some ideas for questions you could add, as this was just a quick 20 m

Interesting Online Tools to Explore for Authentic Mathematical Learning Experiences

Image
  Overview  These are some recent interesting online resources that I have identified that could be used to create authentic learning experiences for mathematics students and improve their general quantitative literacy. 1) Present Value of Cash Flows   2) Data Grapher: GR3 - GR8 3) Math Apprentice   4) Virtual Manipulatives   5) Investopedia 6) Numbeo - Cost of Living   7) Teaching Mathematics using Tennis   8) Validating Questionnares 9) Tinkercad 10) Maths made Magic